Evaluating Branch Potential: A Geospatial Approach to NBFC Expansion in Maharashtra
1. Introduction
The objective of this analysis is to use biophysical and economic indicators to evaluate branch locations for potential demand in Maharashtra. Taking taluka headquarters as possible locations and estimating the catchment to be in a 25km radius, we use factors such as household density, infrastructure growth, and irrigation support to score branches for possible agri-loan and micro-enterprise loan demand. This framework is designed to guide branch expansion strategy, coupled with bureau data and competitor penetration.
A secondary objective was to evaluate existing branch networks. This allows institutions to make more effective decisions about operations — identifying causes for underperformance, exploring strategies at a village-level for lagging branches, and optimizing resource allocation.
2. Factor Analysis
A. Key Factors
We evaluated various factors influencing the selection of a new branch location. All metrics have been computed within a 25 km radius of the taluka headquarters. Each metric is standardized on a scale from 0 to 10.
Household Density
Measures the total number of households in a 25km radius. A high score indicates a dense population and a significant potential customer base.
Built-Up Area Change
Measures the expansion of built-up area over the last decade in a 25km radius. A high score indicates overall development and growth in a region.
Shop Density
Measures the total number of shops of different categories in a 25km radius. It assesses a region's commercial density to gauge its potential for future growth.
Minor Road Density
Measures the density of minor roads in a 25km radius. It represents connectivity within the given region, essential for easy access to the branch and general infrastructure support.
Canal Density
Measures the total length of canals in a 25km radius. A high score signifies greater agricultural productivity and economic stability, driven by reliable irrigation.
Two-wheeler Score
Measures the percentage of two-wheeler owners in a 25km radius. A high score represents general affluence in the given region.
Agricultural Rating
A composite score measuring general agricultural productivity in a 25km radius. It incorporates slope gradient, water endowment index, soil composition (clay content), and terrain characteristics. A high score represents agricultural productivity in the given region.
B. Correlation Analysis
Understanding the relationships between various factors gives us insight into gauging the importance of each, and it is important to verify if our indices are grounded in reality.
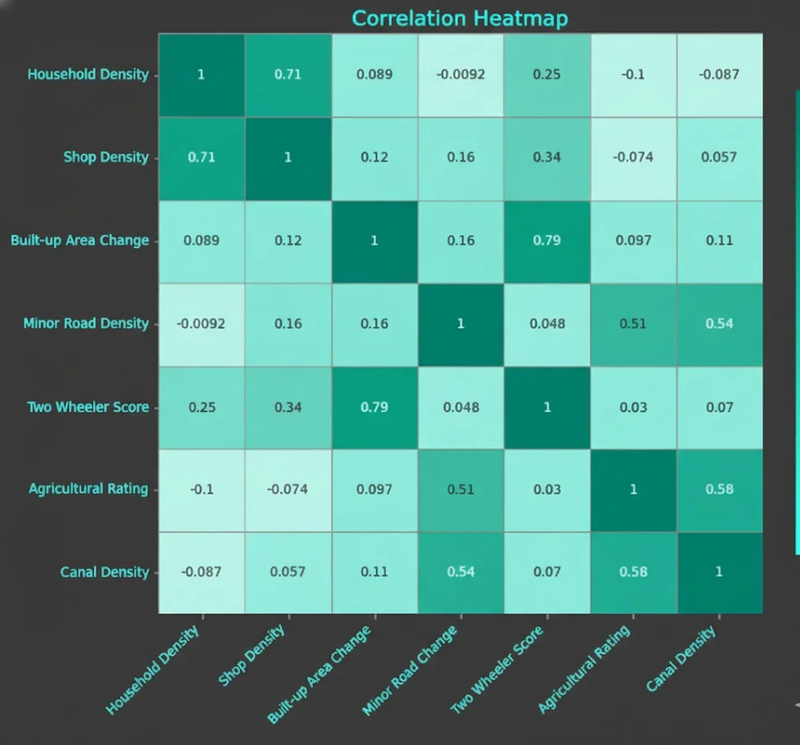
Correlation Heatmap between the Key Factors
High-correlation pairs include:
- High Correlation (0.79) between the two-wheeler score and the built-up area score. This is an interesting correlation — higher population affluence correlating with higher growth suggests that development and wealth accumulation are tightly linked in rural Maharashtra. This warrants further investigation.
- High Correlation (0.71) between household density and shop density. This is expected, as commercial activity naturally concentrates in more populated areas.
- High Correlation (0.58) between canal density and the agricultural rating. This is expected, as the presence of a strong irrigation network generally implies higher agricultural output.
- High Correlation (0.54) between minor road density and canal density. This correlation is reinforced by the similar correlation (0.51) between minor road density and agricultural rating — road networks generally develop near regions with high agricultural output to facilitate transport of produce.
C. Pairwise Analysis
We made pairwise plots for the factors, separating existing branches from potential new locations. This helps us understand patterns in the placement of current branches and discover hidden relations between pairs of features.
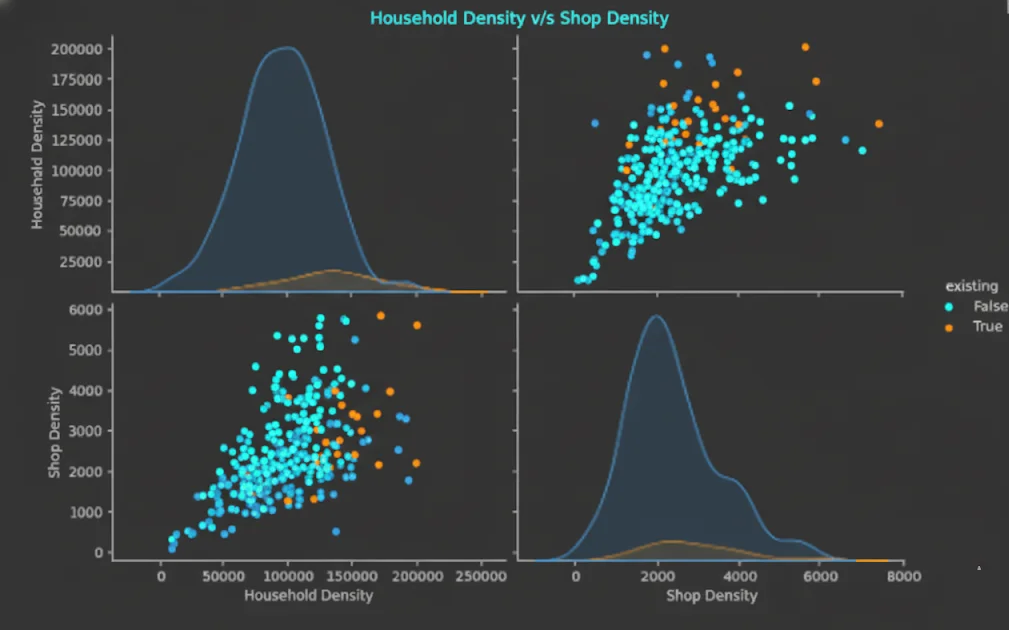
Pairwise Plot: Household Density vs Shop Density
Key Finding
Inference: The current model used to choose branch locations by this NBFC gives more weightage to households than to shops. Our prediction model for Business-centric branches gives more importance to shops.
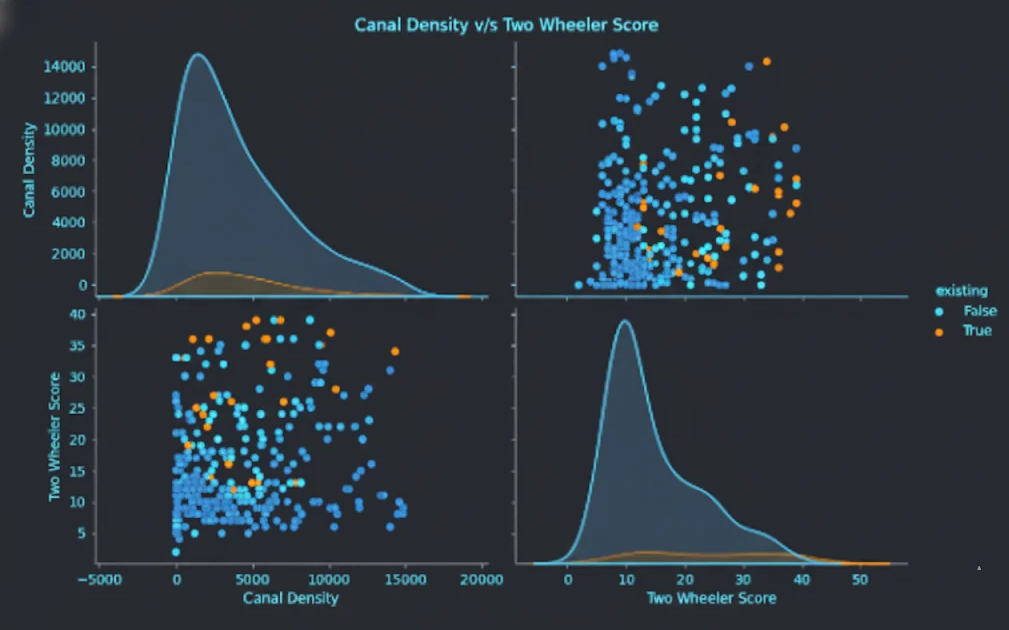
Pairwise Plot: Canal Density vs Two-wheeler Score
Key Finding
Inference: The current model used to choose branch locations by this NBFC gives more weightage to two-wheeler scores than to canal density. Our prediction model for Business-centric branches gives more importance to the two-wheeler score, whereas the Agricultural-centric branches give more weightage to canal density.
3. Methodology for Selection
We analyzed all 355 taluka headquarters in Maharashtra. Our branch ratings are divided into two categories — business-centered and agriculture-centered. Each category uses a different set of factors with varying importance. Based on these, we have created two ratings for branch selection, on a scale of 0 to 10.
A. Removal of District Headquarters Talukas
We excluded talukas containing district headquarters from the scoring, as these urban centers create outlier effects and bias ratings for surrounding talukas.
B. Filters Applied
We first filtered potential locations based on the following threshold criteria:
- Household Density - Only headquarters with more than 100,000 households within a 25 km radius are considered. This results in 191 out of 355 headquarters being included.
- Existing branches - Only headquarters without an existing branch from the partner network are considered. This results in 162 out of 191 headquarters being included.
- Built-up Area - Only headquarters with a built-up area of more than 3,000,000 m² within a 25 km radius are considered. This absolute area threshold ensures a minimum level of development, complementing the Built-Up Area Change factor which measures growth trajectory. This results in 149 out of 162 headquarters being included.
- Minor Road Density - Only headquarters with a length of minor roads more than 1,700,000 m within a 25 km radius are considered. This results in 131 out of 149 headquarters being included.
C. Business-Centered Rating
This is the "business loan" rating given to a branch - the key factors included in this score aim to capture potential for micro-enterprise lending.
Factor Weightages:
- • Household Density: 10%
- • Built-up Area Score: 30%
- • Shop Density: 40%
- • Minor Road Density: 10%
- • Two-wheeler Score: 10%
Shop Density is the most important feature given the focus on micro-enterprise lending. Built-up Area score is also significant as it indicates economic growth, which drives an increase in the number of businesses.
D. Agriculture-Centered Rating
This is the rating given to a branch more focused on providing agricultural loans to farmers.
Factor Weightages:
- • Household Density: 40%
- • Agricultural Score: 40%
- • Canal Density: 10%
- • Minor Road Density: 10%
4. Analysis of Existing Branches
A. Agricultural Rating
Top-performing branches for agriculture-centric operations:
| District | Taluka | Agricultural Rating |
|---|---|---|
| Ahmednagar | Kopargaon | 7.07 |
| Sangli | Palus | 7.00 |
| Satara | Karad | 6.65 |
| Buldhana | Nandura | 6.51 |
| Satara | Phaltan | 6.49 |
Underperforming branches for agriculture-centric operations:
| District | Taluka | Rating | Major Reason |
|---|---|---|---|
| Kolhapur | Bhudargad | 3.91 | Low roads score and agricultural suitability |
| Ahmednagar | Parner | 4.59 | Low household score |
| Nashik | Nandgaon | 4.70 | Low canal score |
| Ahmednagar | Akola | 4.80 | Low canal score |
| Dhule | Sakri | 4.83 | Low household score |
B. Business Rating
Top-performing branches for business-centric operations:
| District | Taluka | Business Rating |
|---|---|---|
| Pune | Khed | 9.2 |
| Sangli | Palus | 9.2 |
| Satara | Karad | 8.7 |
| Kolhapur | Hatkanangle | 8.7 |
| Ahmednagar | Kopargaon | 8.7 |
Underperforming branches for business-centric operations:
| District | Taluka | Rating | Major Reason |
|---|---|---|---|
| Jalgaon | Chopda | 3.3 | Low shop score |
| Jalgaon | Yawal | 4.4 | Low built-up area score |
| Jalgaon | Raver | 5.0 | Low built-up area and minor roads score |
| Nashik | Nandgaon | 5.4 | Low shop score |
| Jalgaon | Bodvad | 5.4 | Low built-up change score |
5. Recommended Locations for New Branches
A. Agricultural Branches
| Rank | District | Taluka | Agricultural Rating |
|---|---|---|---|
| 1 | Nagpur | Kamptee | 7.45 |
| 2 | Sangli | Kadegaon | 7.14 |
| 3 | Bhandara | Lakhandur | 7.13 |
| 4 | Gadchiroli | Desaiganjvadasa | 6.99 |
| 5 | Nagpur | Parseoni | 6.96 |
| 6 | Chandrapur | Brahmapuri | 6.94 |
| 7 | Bhandara | Pauni | 6.84 |
| 8 | Sangli | Walwa | 6.80 |
| 9 | Bhandara | Tumsar | 6.79 |
| 10 | Nagpur | Mauda | 6.76 |
B. Business Branches
| Rank | District | Taluka | Business Rating |
|---|---|---|---|
| 1 | Sangli | Walwa | 9.2 |
| 1 | Sangli | Kadegaon | 9.2 |
| 3 | Nagpur | Kamptee | 8.9 |
| 4 | Nagpur | Hingna | 8.8 |
| 5 | Sangli | Shirala | 8.7 |
| 6 | Nagpur | Nagpur Rural | 8.6 |
| 7 | Nagpur | Kalameshwar | 8.5 |
| 8 | Satara | Wai | 8.2 |
| 9 | Sangli | Tasgaon | 8.0 |
| 10 | Satara | Khandala | 8.0 |
6. Visual Examples
Visual comparisons between high-performing and underperforming locations:
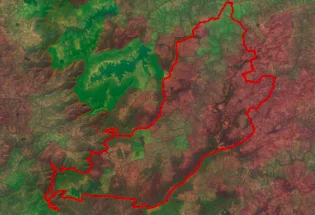
A. Agricultural Rating: Kamptee (Nagpur) vs Bhudargad (Kolhapur)
Kamptee demonstrates superior agricultural suitability compared to Bhudargad, driven by better irrigation infrastructure and soil quality.
Kamptee (Nagpur)
7.45Top Agricultural Location
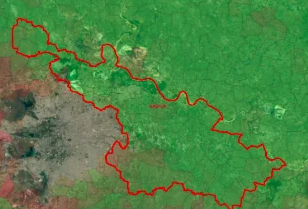
Bhudargad (Kolhapur)
3.91Underperforming Branch
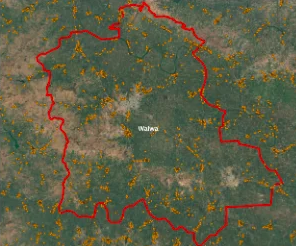
B. Business Branches: Walwa (Sangli) vs Chopda (Jalgaon)
Walwa shows significantly higher shop density and commercial activity compared to Chopda, making it more suitable for micro-enterprise lending.
Walwa (Sangli)
9.2Top Business Location
Chopda (Jalgaon)
3.3Underperforming Branch